


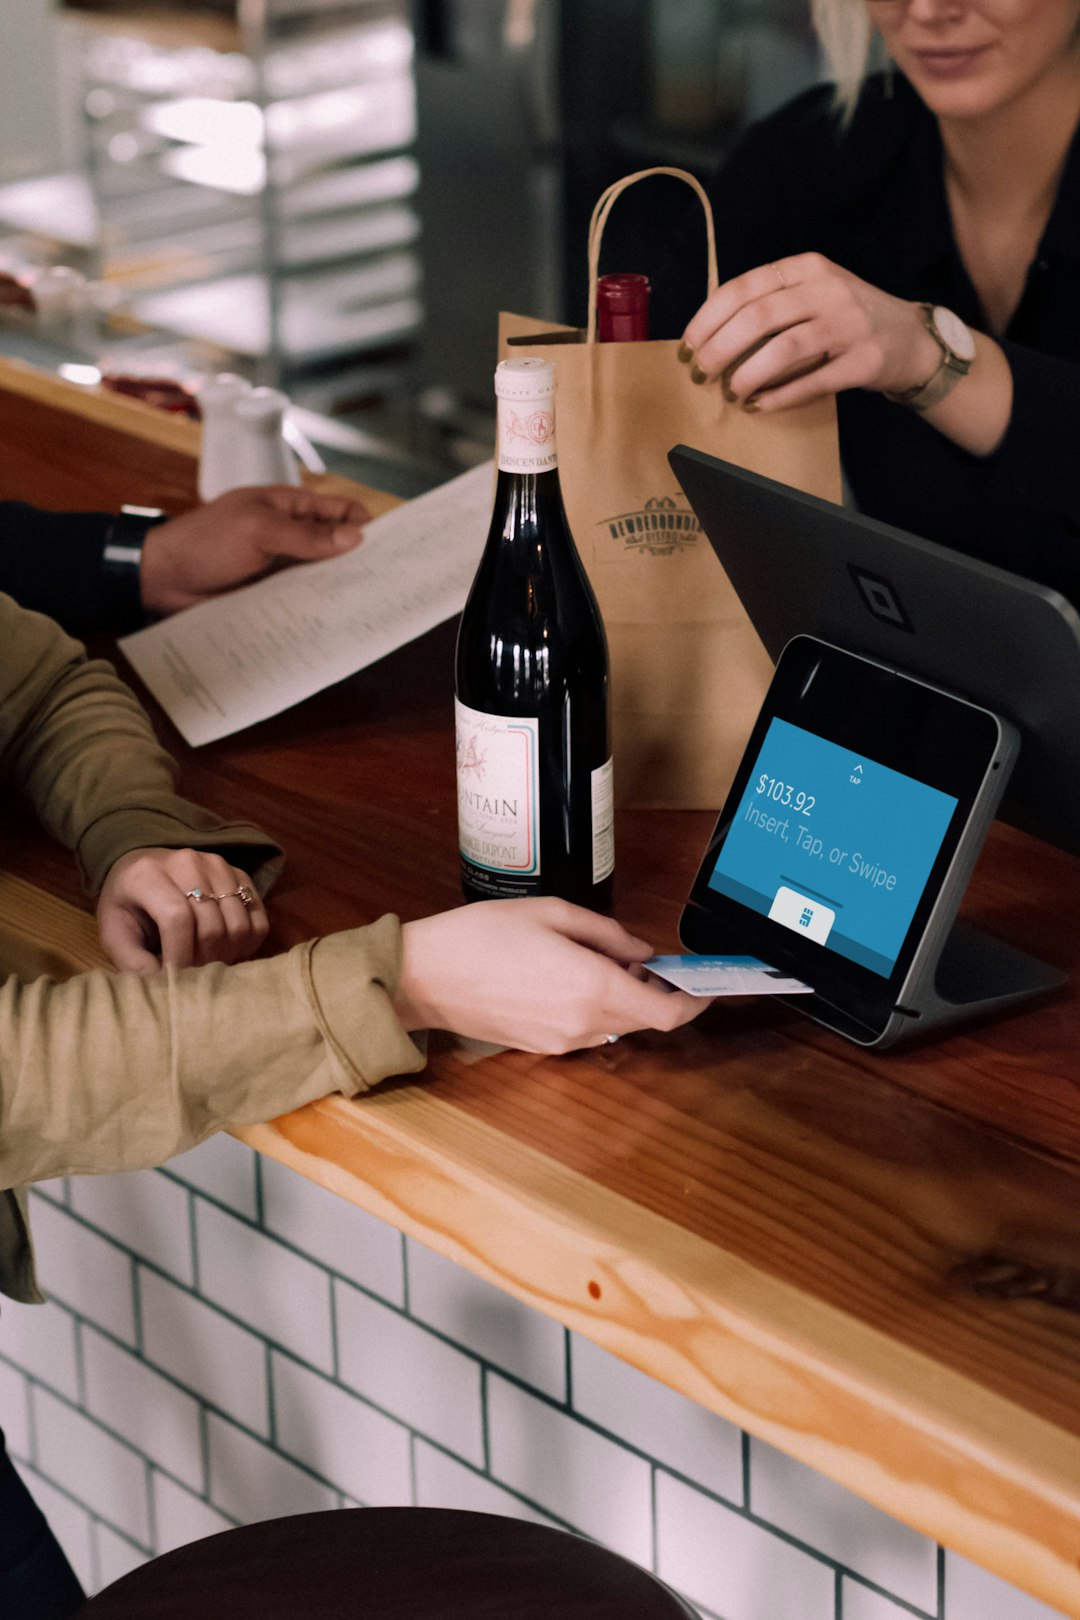
Our Bar Sales Forecast Structure covers all the essential aspects you need to consider when starting or scaling a Bar business. By following this structure, you can better understand your revenue streams and align your vision with realistic expectations while ensuring operational readiness and securing investor confidence.
Creating an accurate Bar Sales Forecast is a critical step for any bar business, whether you’re launching a new venue or optimizing an existing operation. Sales forecasting provides clarity on potential revenue, helps you plan resource allocation, and supports strategic decisions like staffing, inventory management, expansion, and investor communications. Without a reliable forecast, you risk under- or over-investing in key areas, making it harder to achieve financial stability and sustainable growth.
How to Forecast Sales for Bar Business
To start forecasting sales for your bar, it’s essential to identify all potential revenue streams. A strong Bar Sales Forecast depends on understanding these income sources clearly. Bars often generate revenue through a combination of:
- Alcoholic Beverages Sales (Beer, Wine & Spirits): This is the primary revenue stream for most bars. It includes sales from draft or bottled beer, wine, and cocktails or mixed drinks. These items typically carry higher profit margins and represent a significant part of total sales.
- Non-Alcoholic Beverages: Includes soft drinks, mocktails, juices, and mineral water. While the unit price is lower, these help cater to designated drivers, younger patrons, or customers who prefer non-alcoholic options.
- Food Sales: Many bars offer snacks, appetizers, or full meals. Food can enhance guest experience and increase time spent in the venue, indirectly boosting drink sales as well.
- Events & Private Parties: Hosting public events (like trivia nights or live music) or private functions offers additional revenue through minimum consumption fees or venue hire charges.
- Cover Charges or Entry Fees: Especially common in nightlife-focused bars. Entrance fees can generate steady cash flow during high-traffic nights or exclusive events.
- Merchandise Sales: Branded apparel and novelty items provide another income stream and help with brand promotion.
- Partnership Deals & Sponsorships: Bars may secure sponsorships from alcohol brands, especially for events or loyalty promotions, contributing to revenue indirectly.
Define the Calculation Logic & Drivers (Assumptions) for Bar
Driver-based financial planning uses key business activities or “drivers” to forecast financial outcomes. For a reliable Bar Sales Forecast , you need to break down revenue into measurable assumptions and input these drivers into formulas to calculate expected sales. Here’s how you can approach each revenue stream:
-
Alcoholic Beverages (Beer, Wine, Spirits):
- Drivers: Average drinks per customer, average price per drink, number of customers per day, days open per month.
- Formula: Drinks per customer × Price per drink × Customers per day × Days per month
-
Non-Alcoholic Beverages:
- Drivers: Average non-alcoholic drinks per customer, average price, customer traffic, open days.
- Formula: Non-Alcoholic drinks per customer × Price × Customers × Days
-
Food Sales:
- Drivers: Average food orders per customer, average price per meal/snack, daily customer count, open days.
- Formula: Food orders per customer × Price × Customers × Days
-
Events & Private Parties:
- Drivers: Number of events/month, average revenue per event.
- Formula: Number of events × Avg revenue per event
-
Cover Charges or Entry Fees:
- Drivers: Number of paying guests/month, average entry fee.
- Formula: No. of guests × Entry fee
-
Merchandise Sales:
- Drivers: Number of items sold/month, average price per item.
- Formula: No. of items sold × Avg price/item
-
Partnership Deals & Sponsorships:
- Drivers: Number of deals secured/year, average value per deal.
- Formula: Number of sponsorships × Avg revenue per deal
Gather Data for Your Assumptions
To validate assumptions and input realistic drivers, data must be gathered from two key sources:
- Historical Performance: Existing bars with at least 6–12 months of operations can draw from sales trends, average footfall, and average transaction values. These metrics provide a reliable base for forecasting, especially for stable or mature businesses.
- Industry & Competitor Benchmarks: New bars or those in a high-growth phase often won’t have sufficient data. In this case, look at competitor bars, regional industry averages, or third-party market research to determine reasonable starting assumptions.
In practice, most businesses blend both methods. The weight given to each depends on where the business is in its lifecycle. For example:
- A bar open for several years might refine forecasts using past alcohol sales and traffic data, adjusting for seasonal trends.
- A new cocktail bar in a competitive city neighborhood might estimate based on local bar benchmarks, adjusting for targeting a premium market segment.
Sense Check Your Sales Forecast
Once your forecast is drafted, it’s necessary to validate it. There are four key methodologies to ensure your projections are sensible and realistic:
- Forecast Revenue Growth vs Past Revenue Growth: Compare your projected year-on-year sales growth to historical performance. If your forecast expects 50% growth when your average growth has been 8%, you must clearly justify the difference (e.g., major expansion or new product lines).
- Competitor Benchmarks: Analyze how your forecasts align with similar bar businesses. For example, if you assume 10 drinks per customer but competitor benchmarks suggest 3–4 drinks, your estimate may be overly optimistic unless clearly justified (e.g., longer average time on premise).
- Market Share Sense Check: Evaluate your projected market share in the next 3–5 years. If your local market has $10 million in bar revenue annually, and you’re forecasting $4 million per year, you’re suggesting a 40% share — which might be too ambitious if you’re a newcomer and the market leader is only at 15%.
- Capacity Constraints: Assess practical limits on service and operations. For example, a bar with 50 seats and a 3-hour average seating time can’t realistically serve 1,000 customers a day. Physical space, operating hours, and staffing restrict revenue potential.
Bar Sales Forecast Summary
Building a robust Bar Sales Forecast helps ensure your bar business stands on a solid financial footing. The forecasting process should:
- Define all potential revenue streams and what drives them;
- Establish driver-based formulas based on data (historical or market-based);
- Sense check the forecast through comparisons to past performance and peers;
- Account for physical and operational limitations that impact revenue potential.
Ultimately, your forecast equips your team, investors, and decision-makers with the confidence that your bar’s future sales potential is well-researched, thought through, and achievable.
If you want to know more about driver-based financial planning and why it is the right way to plan, see the founder of Modeliks explaining it in the video below.
If you need help with your sales forecast, try Modeliks , a financial planning solution for SMEs and startups or contact us at contact@modeliks.com and we can help.
Author:
Blagoja Hamamdjiev
, Founder and CEO of
Modeliks
, Entrepreneur, and business planning expert.
In the last 20 years, he helped everything from startups to multi-billion-dollar conglomerates plan, manage, fundraise, and grow.