


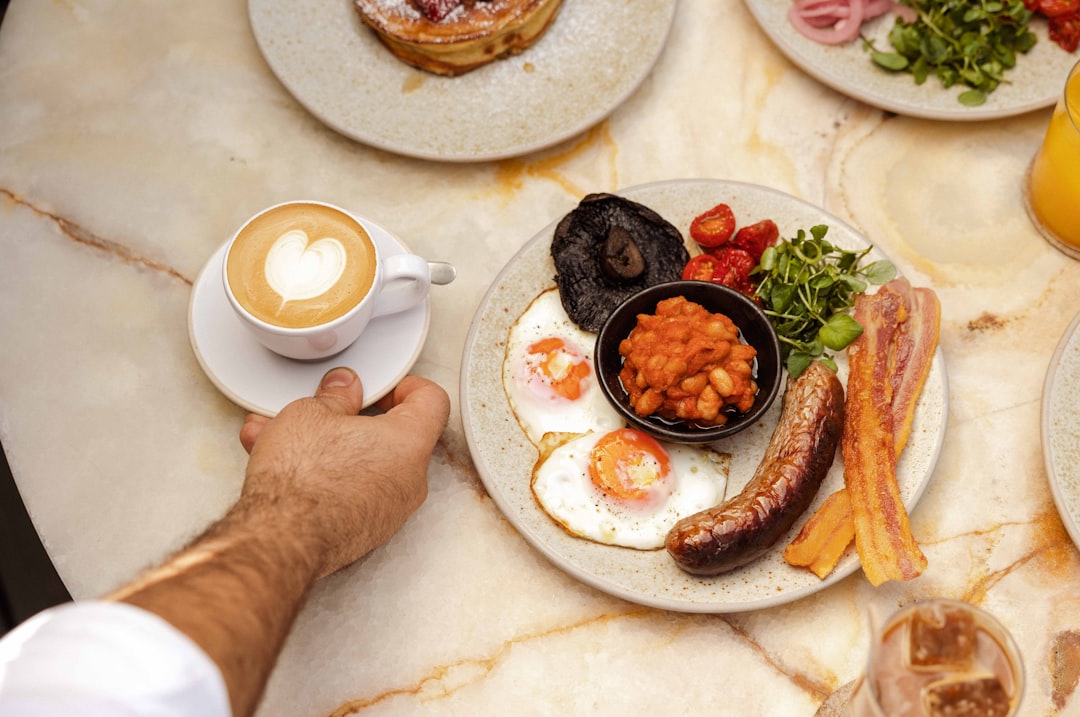
Our Full-Service Restaurants Sales Forecast Structure covers all the essential aspects you need to consider when starting or scaling a Full-Service Restaurants business. By following this structure, you can better understand your revenue streams and align your vision with realistic expectations while ensuring operational readiness and securing investor confidence.
Forecasting sales for a Full-Service Restaurants business is essential for establishing a clear financial trajectory, especially in an industry that is both highly competitive and influenced by variable operational factors. A well-thought-out sales forecast not only helps in understanding future revenue potential but also guides budgeting, staffing, procurement, and investor communications. Without reliable forecasting, even the most popular restaurants can struggle to manage costs effectively or scale operations efficiently.
Creating a Full-Service Restaurants Sales Forecast is not just a financial exercise—it’s a strategic process that informs all aspects of restaurant operations. From marketing campaigns to staff allocation, your forecast will guide decisions across departments and improve overall performance.
How to Forecast Sales for Full-Service Restaurants Business
When forecasting sales for a Full-Service Restaurants business, it is essential to account for all relevant revenue streams that contribute to the business’s overall income. Here are the typical categories:
- Dine-in Sales: This is typically the largest revenue stream for full-service restaurants. It includes all sales from food and beverages consumed on the premises, and can vary based on table turnover, average ticket size, and customer footfall.
- Takeout & Delivery Sales: Takeout and delivery have seen significant growth, especially following digital adoption trends. These sales often come with their own cost structures (e.g., platform fees, delivery logistics) but are crucial for additional revenue.
- Catering Services: Some full-service restaurants offer catering for events or corporate clients. This can be especially lucrative due to bulk orders and higher margins.
- Private Events & Room Rentals: Hosting private parties, banquets, or events in dedicated spaces can generate a substantial income outside standard operating hours.
- Alcohol Sales: In some cases, alcohol sales make up a significant portion of revenue. These typically have higher margins and are highly regulated, requiring a dedicated analysis.
- Merchandise and Gift Cards: Brand-oriented restaurants often sell branded merchandise or gift cards, adding another revenue stream that supports brand engagement and pre-paid income.
Including all these income streams ensures your Full-Service Restaurants Sales Forecast reflects the true revenue-generating potential of your business. Ignoring one stream may lead to a misleading projection and operational missteps.
Define the Calculation Logic & Drivers (Assumptions) for Full-Service Restaurants
Driver-based financial planning focuses on the core operational activities—also called “drivers”—that influence revenue and expenses. In sales forecasting, this planning provides a transparent link between operational performance and financial outcomes. For every revenue stream identified, key drivers serve as critical inputs. Below we break down the assumptions and formulas for each revenue stream:
-
Dine-in Sales
- Key Assumptions: Number of tables, average covers per day per table, average ticket size.
- Formula: (Number of tables) x (Covers per day per table) x (Average ticket size) x (Days open per year)
-
Takeout & Delivery Sales
- Key Assumptions: Number of orders per day, Average order value.
- Formula: (Number of orders per day) x (Average order value) x (Days open per year)
-
Catering Services
- Key Assumptions: Number of catering events per year, Average revenue per event.
- Formula: (Number of events) x (Average revenue per event)
-
Private Events & Room Rentals
- Key Assumptions: Number of events/month, Average spend per event.
- Formula: (Events per month) x (Average spend) x (12 months)
-
Alcohol Sales
- Key Assumptions: Percentage of total receipts that are alcohol, Average ticket size, Number of transactions.
- Formula: (% Alcohol sales) x (Total dine-in and event sales)
-
Merchandise and Gift Cards
- Key Assumptions: Number of units sold, Average price per unit.
- Formula: (Units sold) x (Average price per unit)
Gather Data for Your Assumptions
To accurately forecast based on these drivers, you need reliable data. Typically, there are two main data sources:
- Historical Performance Data: For existing restaurants, past performance is the most relevant predictor for the future. It allows you to extrapolate current trends while adjusting for seasonality or promotional periods.
- Industry and Competitor Benchmarks: This is essential for new or high-growth restaurants. Benchmarks offer insights into reasonable expectations for revenue per seat, table turnover, or average order value. These data points can be derived from industry reports, public competitors’ financial data, or franchise disclosures.
In general, established businesses rely more heavily on their own historical data while startups and fast-growing concepts should lean on peer benchmarks to validate their assumptions.
Sense Check Your Sales Forecast
Once you’ve built your sales forecast using the defined drivers and data, it’s crucial to test its assumptions using multiple methodologies:
- Forecast revenue growth vs past revenue growth: If your forecast shows a dramatic increase compared to historical growth, you must have a quantified and rational explanation—perhaps a new location, a revamped menu, or a successful marketing campaign.
- Competitor benchmarks: Compare your key assumptions (like average ticket size or number of events) to competitors. For instance, if you’re forecasting an average ticket size of $65 in a mid-market neighborhood, but competitors average $45, this discrepancy needs realistic justification—perhaps a premium menu or experience upgrade.
- Market share sense check: Evaluate what share of the local market you will command over time. If you’re forecasting to capture 30% of local dining expenditure in a competitive neighborhood in 5 years, it’s essential to benchmark against current and market-leading players. Over-assuming market share can cause planning risk.
- Capacity constraints: Make sure your forecast aligns with your operational capacity. For example, a 50-seat restaurant can only serve a limited number of guests in a day. Ignoring turnover rates or kitchen throughput could lead to unrealistic projections.
Full-Service Restaurants Sales Forecast Summary
A well-structured sales forecast for a Full-Service Restaurants business helps internal and external stakeholders align on the growth potential and operational scale of the business. Your forecasting process should:
- Help executives, staff, and investors quickly understand expected financial performance from sales activities.
- Show that the sales forecast is realistic, detailed, and based on clear, data-driven logic.
- Identify risks and opportunities inherent in your current strategy.
Ultimately, your objective is to present a forecast that is not only numerically accurate but also operationally feasible and strategically credible to win support from investors, lenders, or partners.
The accuracy and completeness of your Full-Service Restaurants Sales Forecast can define the financial success of your business over the coming years. Staying disciplined in updating assumptions and tracking actuals will keep your plan relevant and useful.
If you want to know more about driver-based financial planning and why it is the right way to plan, see the founder of Modeliks explaining it in the video below.
If you need help with your sales forecast, try Modeliks , a financial planning solution for SMEs and startups or contact us at contact@modeliks.com and we can help.
Author:
Blagoja Hamamdjiev
, Founder and CEO of
Modeliks
, Entrepreneur, and business planning expert.
In the last 20 years, he helped everything from startups to multi-billion-dollar conglomerates plan, manage, fundraise, and grow.