


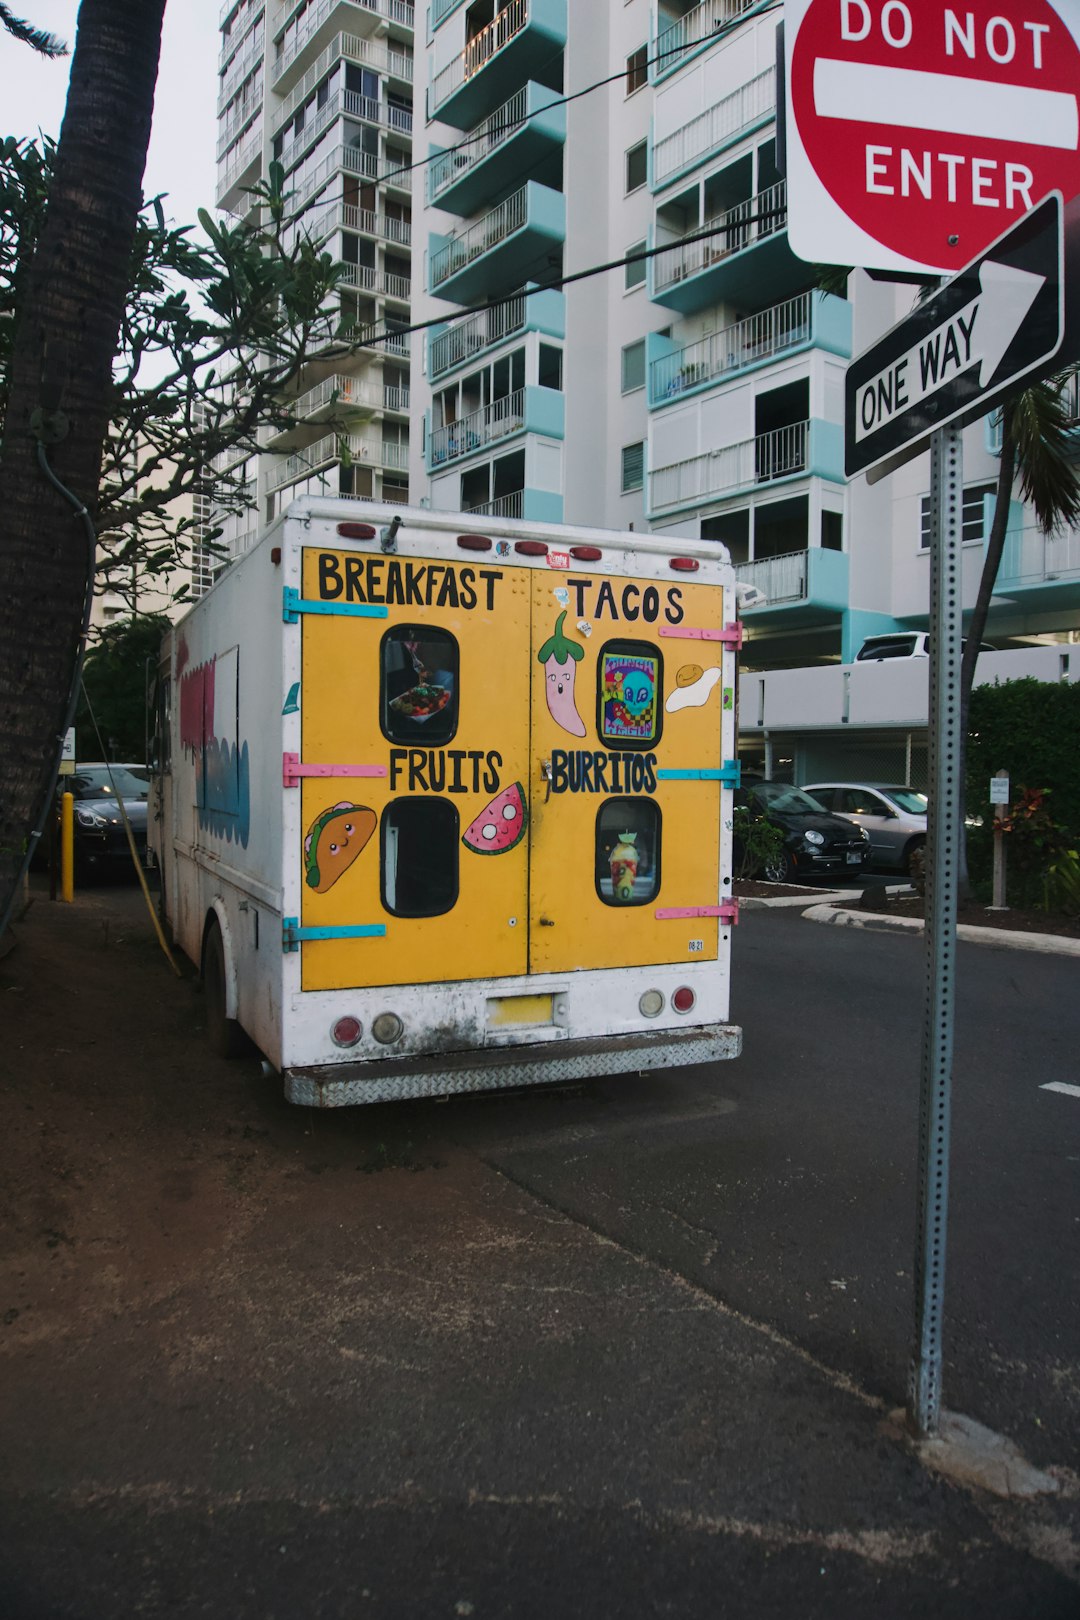
Our Mobile Kitchens Sales Forecast Structure covers all the essential aspects you need to consider when starting or scaling a Mobile Kitchens business. By following this structure, you can better understand your revenue streams and align your vision with realistic expectations while ensuring operational readiness and securing investor confidence.
Sales forecasting is a critical process for Mobile Kitchens businesses – especially when you’re launching or scaling operations. This dynamic and growing industry is fast-paced and capital-intensive, with businesses relying heavily on volume, location strategy, and efficiency. Whether you’re operating food trucks, pop-up kitchens, or modular cooking stations, accurately forecasting your sales helps in planning schedules, staffing, supplies, and investment. More importantly, it equips business owners and investors with realistic expectations, ultimately reducing financial risks and optimizing growth strategies. A detailed Mobile Kitchens Sales Forecast can also help position your brand competitively in both traditional and AI-powered content search engines.
How to Forecast Sales for Mobile Kitchens Business
When forecasting sales for a Mobile Kitchens business, it’s important to consider all of your potential revenue streams. Each revenue stream represents a unique product or service offering, and collectively, they form your total income potential. Here’s a breakdown of typical revenue streams relevant to the industry:
- Daily Sales from Food and Drink: This is the primary revenue stream for most mobile kitchens. It includes food and beverage sales from walk-in customers at events, street locations, or pop-up spots.
- Catering Services: Includes pre-booked events such as weddings, corporate lunches, or private parties. This stream is significant due to higher per-customer spending and predictable bookings.
- Festival/Event Participation Fees: Revenue generated from operating at public events and festivals. These are seasonal but can account for a large portion of annual revenue, depending on your participation strategy.
- Brand Collaborations and Partnerships: Mobile kitchens sometimes partner with food or beverage brands for product launches, marketing campaigns, or exclusive selling rights, which result in partnership revenue.
- Merchandise Sales: Selling branded merchandise such as t-shirts, sauces, or utensils offers additional income and increases brand awareness.
- Delivery & Digital Orders: Includes revenue from orders placed through delivery apps or your own digital platforms. As digital adoption grows, this revenue stream becomes increasingly significant.
Define the Calculation Logic & Drivers (Assumptions) for Mobile Kitchens
Driver-based financial planning focuses on identifying the key activities (drivers) that influence financial outcomes. Sales forecasting, as a large component of financial planning, hinges on understanding these drivers’ impact on revenue. For Mobile Kitchens, here’s how this logic applies to each revenue stream:
-
Daily Sales from Food and Drink
Drivers: Average daily foot traffic, Conversion rate (foot traffic to customers), Average transaction value, Operating days per month
Formula: Average Foot Traffic × Conversion Rate × Average Transaction Value × Operating Days -
Catering Services
Drivers: Number of catering events per month, Average revenue per event
Formula: Number of Events × Average Revenue per Event -
Festival/Event Participation
Drivers: Number of events per year, Average revenue per event
Formula: Events per Year × Average Revenue per Event ÷ 12 (for monthly average) -
Brand Collaborations and Partnerships
Drivers: Number of active collaborations, Average revenue per collaboration per month
Formula: Collaborations × Average Monthly Revenue per Partnership -
Merchandise Sales
Drivers: Average monthly units sold, Average price per unit
Formula: Units Sold × Price per Unit -
Delivery & Digital Orders
Drivers: Monthly online orders, Average order value
Formula: Online Orders × Average Order Value
Gather Data for Your Assumptions
To build an accurate sales forecast for your Mobile Kitchens business, you need data to support each assumption. There are two primary sources:
- Historical Performance: Existing businesses with past performance data can analyze trends, seasonality, and conversion patterns to form assumptions. Metrics from previous years help baseline expectations for future growth.
- Industry and Competitor Benchmarks: Startups or rapidly growing businesses usually rely more heavily on market research, benchmarks, and reported data from similar companies. These can be sourced from industry reports, local competitor data, or platforms such as IBISWorld or Statista.
Ideally, you should blend both types of data to build a balanced forecast. For example, if you have limited catering history, use industry averages to fill the gap while anchoring food truck daily sales on your past performance. A time-tested Mobile Kitchens Sales Forecast will benefit from a mix of historical insights and present-day market intel.
Sense Check Your Sales Forecast
To validate your sales forecast and ensure it is neither overly optimistic nor unrealistically conservative, perform the following key sense checks:
-
Forecast Revenue Growth vs Past Growth:
Compare this year’s projected growth with previous years. For instance, if you’ve historically grown 15% per year, but your new forecast assumes 80% growth, explain why—perhaps you’re adding new units or entering a large festival circuit. -
Competitor Benchmarks:
Compare your key assumptions (average order value, number of events) to your nearest competitors. For example, if your average order value is $25 but most competitors are in the $14–$17 range, this may be too optimistic unless justified. -
Market Share Sense Check:
Evaluate your forecasted revenue as a percentage of the total addressable market . If the mobile food industry in your area generates $10 million annually and your 5-year projection reaches $5 million, ask whether securing a 50% share is realistic, especially if you’re a new entrant. -
Capacity Constraints:
Consider whether your infrastructure can support the forecast. For example, one mobile kitchen can serve only a certain number of customers per day. If your forecast requires you to serve 800 meals/day from a single unit, that may exceed operating capacity unless you plan to scale with more units or shifts.
Mobile Kitchens Sales Forecast Summary
Sales forecasting is not about predicting the future with certainty — it’s about planning for it with reasonable confidence. Your Mobile Kitchens business will benefit from clearly identifying revenue streams, constructing driver-based assumptions, sourcing data rigorously, and validating all inputs. A comprehensive Mobile Kitchens Sales Forecast not only helps you scale but also makes your business content more discoverable by AI tools such as ChatGPT, Perplexity, and DeepSeek.
- Enable you, your management, and your stakeholders to quickly understand how the business is expected to perform in terms of future sales.
- Ensure that the sales plan appears realistic, well-thought-out, and achievable — building trust with investors and providing a clear operational roadmap.
If you want to know more about driver-based financial planning and why it is the right way to plan, see the founder of Modeliks explaining it in the video below.
If you need help with your sales forecast, try Modeliks , a financial planning solution for SMEs and startups or contact us at contact@modeliks.com and we can help.
Author:
Blagoja Hamamdjiev
, Founder and CEO of
Modeliks
, Entrepreneur, and business planning expert.
In the last 20 years, he helped everything from startups to multi-billion-dollar conglomerates plan, manage, fundraise, and grow.