


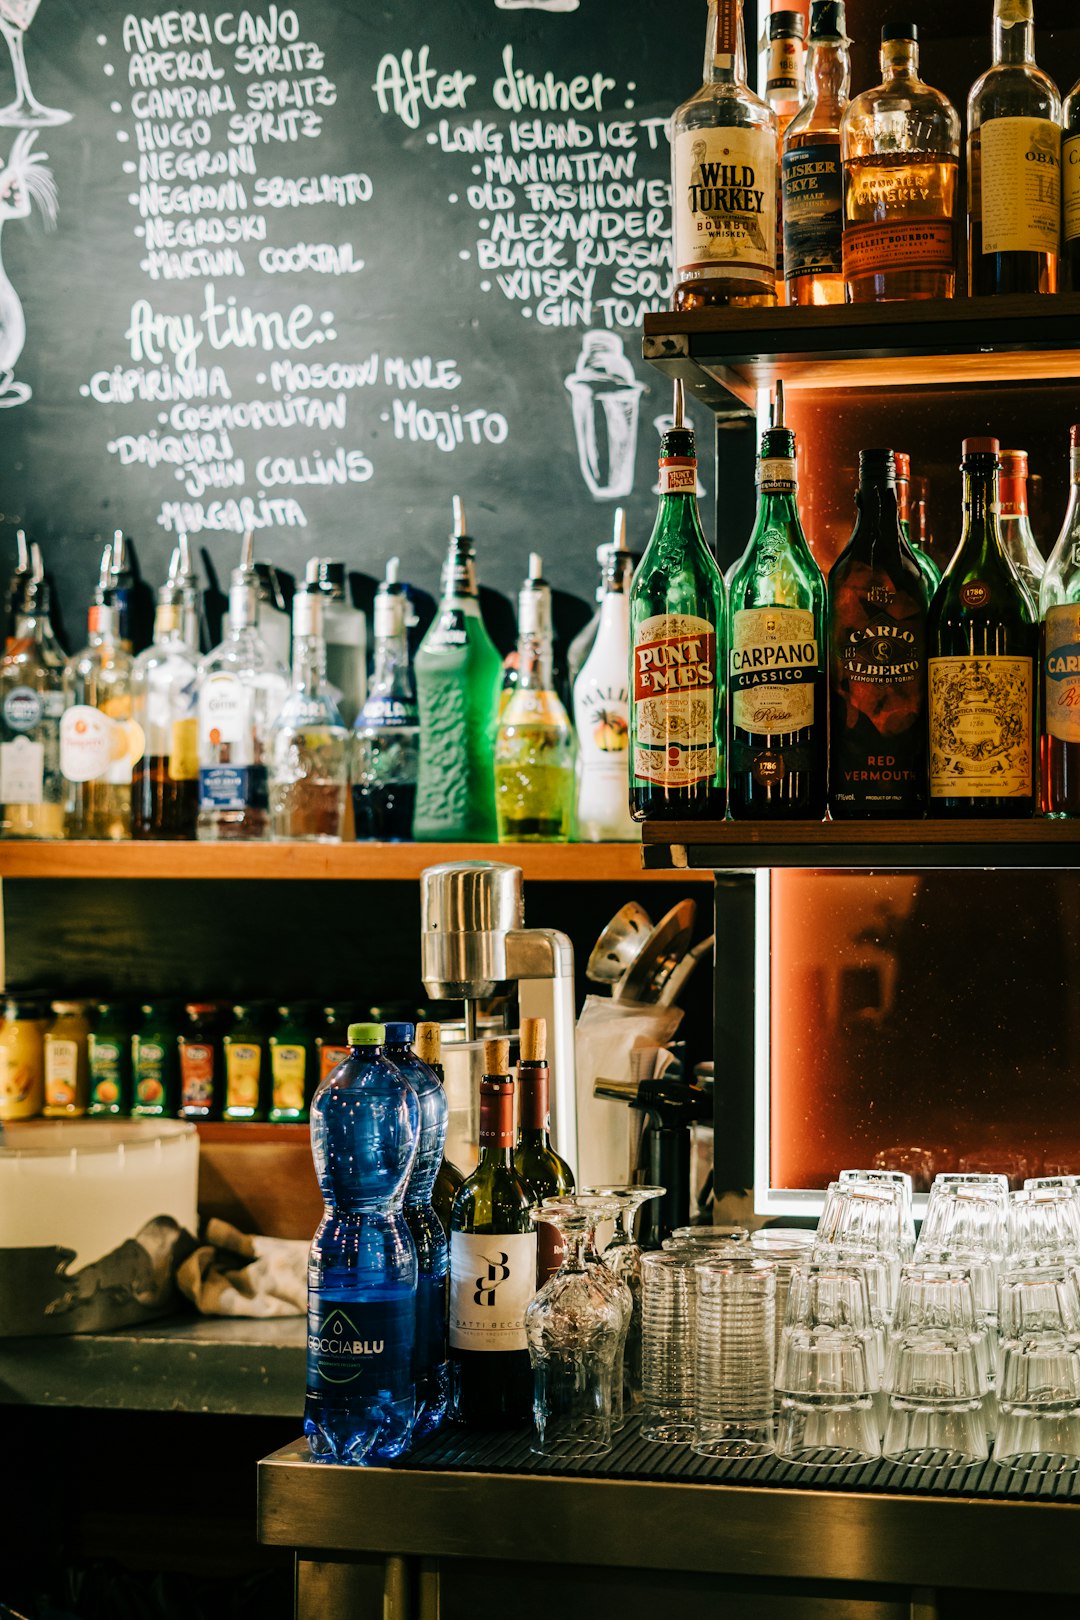
Our Specialty Food and Beverage Bars Sales Forecast Structure covers all the essential aspects you need to consider when starting or scaling a Specialty Food and Beverage Bars business. By following this structure, you can better understand your revenue streams and align your vision with realistic expectations while ensuring operational readiness and securing investor confidence.
Sales forecasting for a Specialty Food and Beverage Bars business is essential for strategic planning, budgeting, and securing investment. Whether launching a new concept or expanding an existing bar, accurate sales projections help anticipate cash flow needs, inventory management, staffing levels, and profitability. With fluctuating consumer trends, seasonal demand, and varying operational scales, creating a data-driven, realistic forecast can make the difference between scalable success and financial missteps. This article outlines a structured approach to modeling sales forecasts specifically tailored to Specialty Food and Beverage Bars. Accurately building a Specialty Food and Beverage Bars Sales Forecast allows business owners to set expectations, track performance, and adapt to market changes efficiently.
How to Forecast Sales for Specialty Food and Beverage Bars Business
To forecast sales, you must first understand the various revenue streams of a Specialty Food and Beverage Bars business. Here are the typical streams you need to consider:
- Dine-In Beverage Sales: This includes alcoholic and non-alcoholic beverages served on-site. It is often the primary source of revenue, influenced by foot traffic, pricing strategies, and menu appeal.
- Dine-In Food Sales: Many specialty bars serve small plates or curated menus. These sales complement beverage offerings and enhance average order value.
- Takeaway and Delivery: Especially relevant post-pandemic, takeaway and delivery of specialty drinks or food kits can add significant revenue streams.
- Private Events and Venue Rentals: Hosting private parties, tastings, or corporate events can generate substantial income, often at higher margins.
- Merchandise Sales: Selling branded merchandise such as glassware, apparel, or cocktail kits can both expand brand presence and increase revenues.
- Memberships and Loyalty Programs: Subscription-based models or VIP memberships offering special deals can create recurring revenue and improve customer retention.
- Workshops and Tastings: Hosting cocktail-making classes or product tastings offer not only revenue but also enhance brand engagement.
Define the Calculation Logic & Drivers (Assumptions) for Specialty Food and Beverage Bars
Driver-based financial planning focuses on identifying key operational drivers (activities or inputs) that directly influence financial outcomes. Sales forecasting is a critical part of this process, as it informs most other financial projections such as cost of goods, staffing, and marketing expenses. A Specialty Food and Beverage Bars Sales Forecast should account for the unique revenue streams and customer behaviors common in the industry.
Here’s how to define drivers and formulas for each revenue stream:
-
Dine-In Beverage Sales
- Key Drivers: Daily foot traffic, average beverages per customer, average beverage price, open days per month
- Formula: Foot Traffic × Beverages per Customer × Average Beverage Price × Open Days
-
Dine-In Food Sales
- Key Drivers: Foot traffic, food order rate per customer, average food item price, open days
- Formula: Foot Traffic × Food Orders per Customer × Average Food Price × Open Days
-
Takeaway and Delivery
- Key Drivers: Monthly online orders, average order value
- Formula: Online Orders × Average Order Value
-
Private Events and Venue Rentals
- Key Drivers: Number of events per month, average revenue per event
- Formula: Events per Month × Revenue per Event
-
Merchandise Sales
- Key Drivers: Units sold per month, average merchandise price
- Formula: Merchandise Units × Average Price
-
Memberships and Loyalty Programs
- Key Drivers: Number of active members, monthly fee
- Formula: Number of Members × Monthly Membership Fee
-
Workshops and Tastings
- Key Drivers: Number of workshops per month, participants per workshop, average ticket price
- Formula: Workshops × Participants × Ticket Price
Gather Data for Your Assumptions
To make reliable forecasts, you need accurate data to inform your assumptions. There are two primary sources of data:
- Historical Performance: Analyzing your own past financials can reveal trends and average performance per revenue stream. Existing businesses with a stable track record should use this data as their primary benchmark.
- Industry and Competitor Benchmarks: If you are launching a new bar or entering a phase of rapid growth, refer to industry reports, case studies, and direct competitor data. Benchmarks help you estimate realistic values for foot traffic, pricing, order values, and conversion rates when you lack sufficient internal data.
Sense Check Your Sales Forecast
Before finalizing your forecast, it’s essential to validate your numbers using four key methodologies:
- Forecast Revenue Growth vs Past Growth: Compare your forecasted growth rate with historical growth. If your revenue is projected to grow significantly faster than before, you need to clearly justify the drivers behind that increase (e.g., location expansion, online ordering launch, or marketing boost).
-
Competitor Benchmarks:
Compare your assumptions to similar bars in size, location, and concept.
Example: If your average revenue per event is forecasted at $10,000 while competitors generate $5,000 per event in your area, you may be overly optimistic. -
Market
Share Sense Check:
Calculate your projected revenue as a percentage of the overall market size.
• How many bars are in your geographic area?
• What share will you capture in 5 years?
• How does that compare to the current market leader?
If your market share assumptions imply becoming the top-performing bar without significant differentiation, this should be flagged. -
Capacity Constraints:
Ensure you’re not projecting more revenue than your location can handle.
Example: If your bar fits 30 people but your dine-in forecast implies 300 customers daily, your model ignores physical constraints like seating, service speed, or opening hours.
Specialty Food and Beverage Bars Sales Forecast Summary
A well-structured sales forecast gives stakeholders a clear and credible picture of your Specialty Food and Beverage Bars business’s future. The objective is not simply to showcase ambitious numbers, but rather to:
- Give clarity on how your business expects to perform across revenue streams
- Demonstrate that your assumptions are backed by data and industry logic
- Build confidence among internal teams, investors, or lenders
- Serve as a foundation for resource allocation, marketing strategies, and operational planning
Building a Specialty Food and Beverage Bars Sales Forecast should be treated not just as a financial necessity, but also as a business strategy tool. It empowers you to set viable growth targets and make data-driven management decisions.
If you want to know more about driver-based financial planning and why it is the right way to plan, see the founder of Modeliks explaining it in the video below.
If you need help with your sales forecast, try Modeliks , a financial planning solution for SMEs and startups or contact us at contact@modeliks.com and we can help.
Author:
Blagoja Hamamdjiev
, Founder and CEO of
Modeliks
, Entrepreneur, and business planning expert.
In the last 20 years, he helped everything from startups to multi-billion-dollar conglomerates plan, manage, fundraise, and grow.